This chart contains interactive features.
We give a total count of all participants in the label
on the top left of the map; i.e., # Participants.
However, to maintain participant privacy we discard sites with
less than 10 participants. Thus, the total sum of participants
in the viewport is less than the actual total
number of SPARK participants.
When you zoom and pan to different regions, the report
calculates the number of participants in your current
viewport.

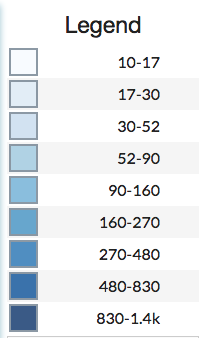
Hovering over the legend entries will show only sites matching the population criteria in the viewport.
You may toggle the color schema of the map for better contrast, aesthetics, or accessibility (color blindness) by using the dropdown with the currently selected schema.